General
 Force Field Analysis
Quality Management - General
January 22, 2020
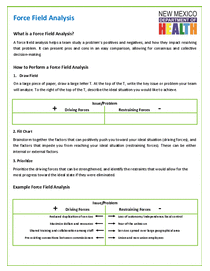
A force field analysis helps a team study a problem’s positives and negatives
 Lean
Quality Management - General
January 22, 2020
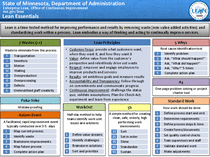
Lean is a time-tested method for improving performance and results by removing waste (non-value added activities) and standardizing work within a process.
 Pareto Chart
Quality Management - General
January 22, 2020
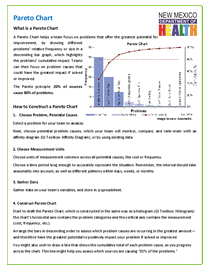
A Pareto Chart helps a team focus on problems that offer the greatest potential for improvement
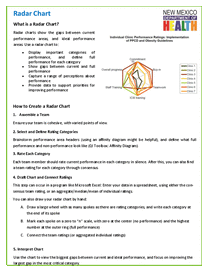 Radar Chart
Quality Management - General
January 22, 2020
Radar charts show the gaps between current performance areas, and ideal performance areas.
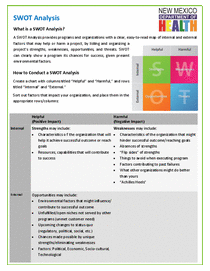 SWOT Analysis
Quality Management - General
January 22, 2020
A SWOT Analysis provides programs and organizations with a clear, easy-to-read map of internal and external
 Tree Diagram
Quality Management - General
January 22, 2020
Tree Diagrams help link a task’s overall goals and sub-goals, and helps make complex tasks more visually manageable.
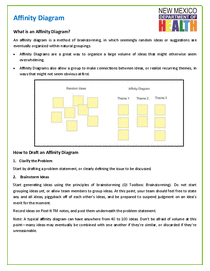 Affinity Diagram
Quality Management - General
January 22, 2020
An affinity diagram is a method of brainstorming, in which seemingly random ideas or suggestions are eventually organized within natural groupings.
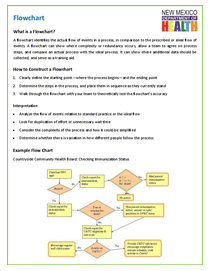 Flowchart
Quality Management - General
January 22, 2020
A flowchart identifies the actual flow of events in a process, in comparison to the prescribed or ideal flow of events.
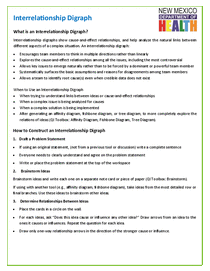 Interrelationship Digraph
Quality Management - General
January 22, 2020
Interrelationship digraphs show cause-and-effect relationships, and help analyze the natural links between different aspects of a complex situation.
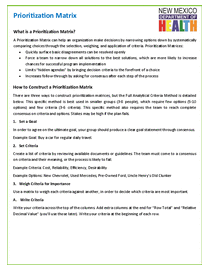 Prioritization Matrix
Quality Management - General
January 22, 2020
A Prioritization Matrix can help an organization make decisions by narrowing options down by systematically comparing choices through the selection, weighing, and application of criteria.
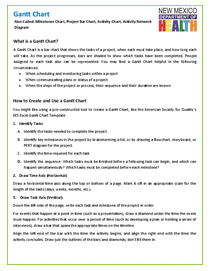 Gantt Chart
Quality Management - General
January 22, 2020
A Gantt Chart is a bar chart that shows the tasks of a project, when each must take place, and how long each will take.
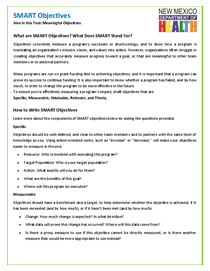 SMART Objectives
Quality Management - General
January 22, 2020
Objectives concretely measure a program’s successes or shortcomings, and to show how a program is translating an organization’s mission, vision, and values into action.
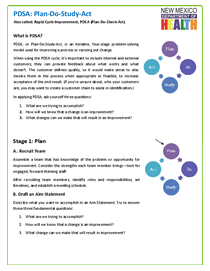 Plan-Do-Study-Act
Quality Management - General
January 22, 2020
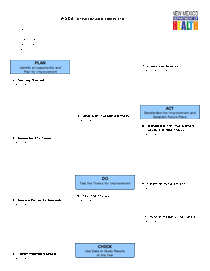
PDSA, or Plan-Do-Study-Act, is an iterative, four-stage problem-solving model used for improving a process or carrying out change.
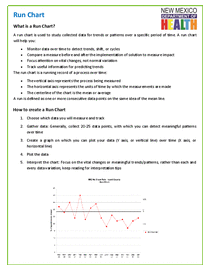 Run Chart
Quality Management - General
January 22, 2020
A run chart is used to study collected data for trends or patterns over a specific period of time.
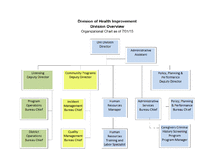 Division of Health Improvement Organizational Structure
Human Resources - General
January 22, 2020
This document provides the latest organizational structure for the Division of Health Improvement.
 Clinical Laboratory Improvement Act Historical Information
Program Operations - General
January 22, 2020
The Clinical Laboratory Improvement Act began in the late 1960's when problems arose in the cytology laboratories that read PAP smears. The personnel in these laboratories were overworked and had a very high error rate. In 1967, the Clinical Laboratory Improvement Amendment was passed and the first laboratory regulations were born. These regulations primarily covered independent and hospital laboratories.
 Live Blood Cell Analysis Under the Clinical Laboratory Improvement Act
Program Operations - General
January 22, 2020
Live Blood Cell Analysis is a test which is used for the purpose of providing information for the diagnosis, prevention, or treatment of any disease or impairment of, or assessment of the health of human beings. The Health Care Financing Administration (now the Centers for Medicare & Medicaid Services) Office of General Counsel determined in August, 1997, that Live Blood Cell Analysis was subject to all Clinical Laboratory Improvement Act requirements.
 Nurse Aide Registry Test Fee Rates
Program Operations - General
January 22, 2020
Nurse Aide Registry Test Fee Rates
 College of American Pathologists Certificate
Scientific Laboratory - General
January 9, 2020
The college of American pathologists certifies that the New Mexico Department of Health Scientific Laboratory Division has bet all applicable standards for accreditation and is hereby accredited by the college of American pathologists laboratory accreditation program.
