Quality Management Bureau
Publications
 DDW-CLCI-TotalCare-SE-201411-Initial
Quality Management - Survey
January 23, 2020
Report of findings.
 DDW-CLCI-TransitionalLifestyles-MET-201509-Routine-201606-Verification
Quality Management - Survey
January 23, 2020
Report of findings.
 DDW-CLCI-ActiveSolutions-SW-201706-Routine
Quality Management - Survey
January 23, 2020
Report of findings.
 DDW-CLCI-CasaEsperanza-SW-SE-201704-Routine
Quality Management - Survey
January 23, 2020
Report of findings.
 DDW-CLCI-Tresco-SW-201508-Verification
Quality Management - Survey
January 23, 2020
Report of findings.
 DDW-CLCI-GraceRequiresUnderstanding-SW-201404-Routine
Quality Management - Survey
January 23, 2020
Report of findings.
 DDW-CLCI-GraceRequiresUnderstanding-SW-201409-Verification
Quality Management - Survey
January 23, 2020
Report of findings.
 DDW-CLCI-Tungland-NW-201510-Routine
Quality Management - Survey
January 23, 2020
Report of findings.
 SDW-SelfDirectedChoices-STATEWIDE-201712-Routine
Quality Management - Survey
January 23, 2020
Report of findings.
 DDW-CLCI-LinksLife-SW-201802-Routine
Quality Management - Survey
January 23, 2020
Report of findings.
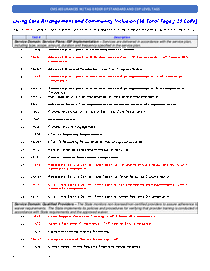 CMS Assurances with Tag Order of Standard and COP Level Tags
Quality Management - Guide
January 22, 2020
CMS Assurances Tag Order of Standard and COP Level Tags
 Attachment B: Living Arrangements and Community Inclusion Determination Process
Quality Management - Guide
January 22, 2020
Attachment B: Living Arrangements and Community Inclusion Determination Process
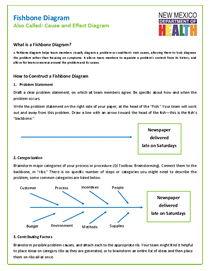 Fishbone Diagram (Cause and Effect Diagram)
Quality Management - General
January 22, 2020
Fishbone Diagram (Cause and Effect Diagram)
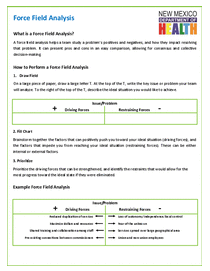 Force Field Analysis
Quality Management - General
January 22, 2020
A force field analysis helps a team study a problem’s positives and negatives
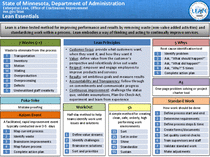 Lean
Quality Management - General
January 22, 2020
Lean is a time-tested method for improving performance and results by removing waste (non-value added activities) and standardizing work within a process.
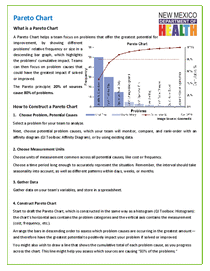 Pareto Chart
Quality Management - General
January 22, 2020
A Pareto Chart helps a team focus on problems that offer the greatest potential for improvement
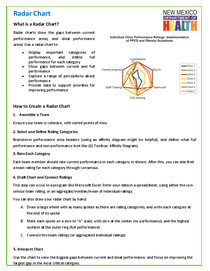 Radar Chart
Quality Management - General
January 22, 2020
Radar charts show the gaps between current performance areas, and ideal performance areas.
