Quality Management Bureau
Publications
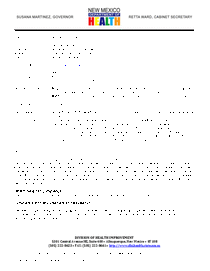 DDW-CLCI-ActiveSolutions-MET-201408-Routine
Quality Management - Survey
January 23, 2020
Report of findings.
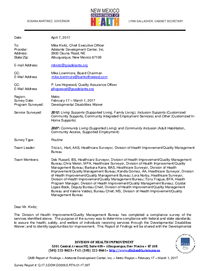 DDW-CLCI-Adelante-MET-201702-Routine
Quality Management - Survey
January 23, 2020
Report of findings.
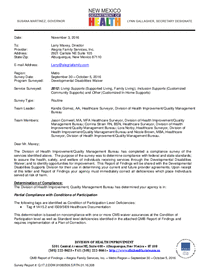 DDW-CLCI-Alegria-MET-201610-Routine-201704-Verification
Quality Management - Survey
January 23, 2020
Report of findings.
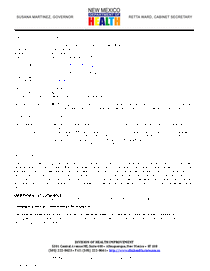 DDW-CLCI-LifeQuest-SW-201504-Routine
Quality Management - Survey
January 23, 2020
Report of findings.
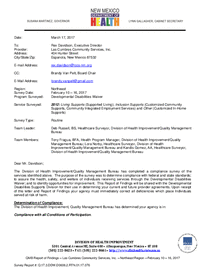 DDW-CLCI-LasCumbres-NE-201702-Routine
Quality Management - Survey
January 23, 2020
Report of findings.
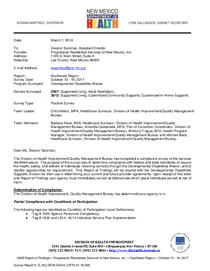 DDW-CLCI-ProgressiveResidential-SW-201710-Routine
Quality Management - Survey
January 23, 2020
Report of findings.
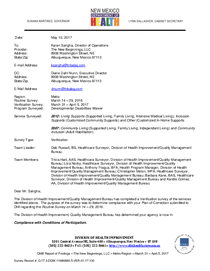 DDW-CLCI-NewBeginnings-MET-201703-Verification
Quality Management - Survey
January 23, 2020
Report of findings.
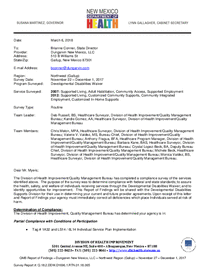 DDW-CLCI-Dungarvin-NW-Gallup-201711-Routine
Quality Management - Survey
January 23, 2020
Report of findings.
 DDW-CMGS-Quality-MET-201810-Routine
Quality Management - Survey
January 23, 2020
Report of findings.
 DDW-CLCI-LifeRoots-MET-201409-Routine
Quality Management - Survey
January 23, 2020
Report of findings.
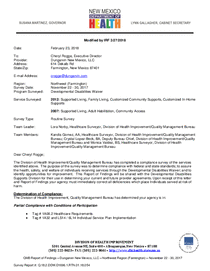 DDW-CLCI-Dungarvin-NW-Farmington-201711-Routine
Quality Management - Survey
January 23, 2020
Report of findings.
 DDW-CLCI-ActiveSolutions-SW-201304-Routine
Quality Management - Survey
January 23, 2020
Report of findings.
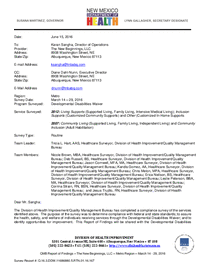 DDW-CLCI-NewBeginnings-MET-201603-Routine
Quality Management - Survey
January 23, 2020
Report of findings.
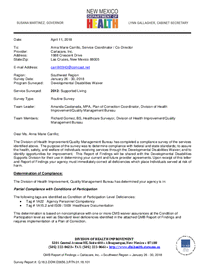 DDW-CLCI-CarlaCare-SW-201801-Routine
Quality Management - Survey
January 23, 2020
Report of findings.
