Quality Management Bureau
Publications
 DDW-CLCI-AbilityFirst-MET-SW-201306-Routine
Quality Management - Survey
January 23, 2020
Report of findings.
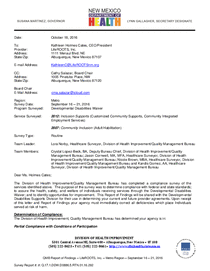 DDW-CLCI-LifeRoots-MET-201609-Routine-201704-Verification
Quality Management - Survey
January 23, 2020
Report of findings.
 DDW-CLCI-LessonsLife-SE-SW-201512-Routine
Quality Management - Survey
January 23, 2020
Report of findings.
 DDW-CLCI-ActiveSolutions-MET-201707-Routine
Quality Management - Survey
January 23, 2020
Report of findings.
 DDW-CLCI-Cornucopia-MET-201611-Routine
Quality Management - Survey
January 23, 2020
Report of findings.
 DDW-CLCI-Cornucopia-MET-201708-Verification
Quality Management - Survey
January 23, 2020
Report of findings.
 DDW-CLCI-AboveBeyond-MET-201301-Routine
Quality Management - Survey
January 23, 2020
Report of findings.
 DDW-CLCI-NezzyCare-SE-SW-201705-Routine
Quality Management - Survey
January 23, 2020
Report of findings.
 DDW-CLCI-AboveBeyond-MET-201508-Routine
Quality Management - Survey
January 23, 2020
Report of findings.
 DDW-CLCI-PersonCenterServices-NE-201701-Routine
Quality Management - Survey
January 23, 2020
Report of findings.
 DDW-CLCI-PersonCenterServices-NE-201707-Verification
Quality Management - Survey
January 23, 2020
Report of findings.
 DDW-CLCI-LessonsLife-SW-201412-Routine
Quality Management - Survey
January 23, 2020
Report of findings.
 DDW-CLCI-SantaLucia-NE-201708-Routine
Quality Management - Survey
January 23, 2020
Report of findings.
 DDW-CLCI-LessonsLife-SW-201508-Verification
Quality Management - Survey
January 23, 2020
Report of findings.
 DDW-CLCI-LifeMission-MET-201402-Initial
Quality Management - Survey
January 23, 2020
Report of findings.
 DDW-CMGS-Quality-MET-201701-Routine
Quality Management - Survey
January 23, 2020
Report of findings.
 DDW-CLCI-LifeMission-MET-201512-Routine
Quality Management - Survey
January 23, 2020
Report of findings.
 DDW-CLCI-ActiveSolutions-MET-201303-Routine
Quality Management - Survey
January 23, 2020
Report of findings.


